Debug Latency Like an Investigator
High CPU is not required for high latency. Follow percentile shape and trace wait time before scaling blindly.
Start with the shape, not a guess
If p50 is normal but p99 grows, a smaller group is queued, locked, paused, or waiting on a dependency. CPU can be low throughout.
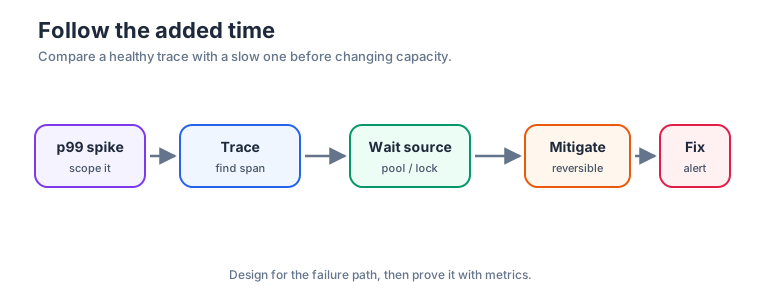 A latency investigation follows added time through traces, pool wait, database waits and downstream services
| Symptom | Test first |
|---|---|
| p50 and p99 rise | Broad capacity, network, deploy, or dependency issue. |
| Only p99 rises | Queueing, locks, GC, pool wait, retries, slow subset. |
| Every morning | Batch reports, backup, cache expiry, scheduled work. |
| Restart helps briefly | Warm cache, leak, churn, periodic trigger. |
Safe response sequence
- Record window, route/tenant/region, percentiles, error rate.
- Compare healthy and slow traces; locate the span that gained time.
- Inspect queue age, pool acquisition, query plan/locks, pauses, or dependency timing.
- Apply the smallest reversible mitigation and verify the same metric improves.
- Fix root cause and alert on the leading signal.
⚠️ Do not scale first. More app servers can mean more borrowers for the same exhausted connection pool. Prove where the wait lives.