Observability: Logs, Metrics & Traces
When production breaks at 3 a.m., observability tells you what, where and why. Learn the three pillars, the golden signals, SLOs and OpenTelemetry.
The big idea
A car dashboard shows your speed, fuel and engine temperature (metrics). The car's black box records every event (logs). And if you tracked one trip across the city, street by street, you'd have a trace.
Observability is how well you can understand what's happening inside your system from the outside, especially problems you didn't predict.
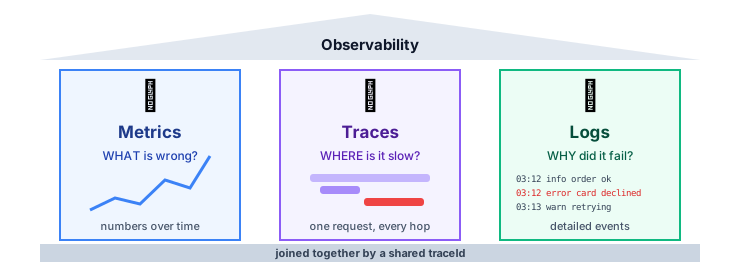 The three pillars: metrics tell you WHAT is wrong, traces tell you WHERE, logs tell you WHY
Pillar 1: Logs, the "why"
A log is a timestamped record of an event. Write structured logs (JSON), not free text, so machines can search and filter them.
// ❌ Unstructured: hard to search, no context
console.log("Payment failed for user 42");

// ✅ Structured (pino): every field is searchable
logger.error(
  { event: "payment_failed", userId: 42, orderId: "ord_9", amountCents: 4999, provider: "stripe", traceId, err },
  "Payment failed",
);
{"level":"error","time":"2026-09-28T03:12:45.120Z","event":"payment_failed","userId":42,"orderId":"ord_9","provider":"stripe","traceId":"4bf92f35","msg":"Payment failed"}
Log levels
| Level | Use for | In production? |
|---|---|---|
debug | Detailed developer info | Usually off |
info | Normal business events (order placed) | ✅ |
warn | Something odd but handled (retrying) | ✅ |
error | A request failed | ✅ + alert on spikes |
fatal | The process is crashing | ✅ + page someone |
⚠️ Never log passwords, tokens, full credit-card numbers or other personal data you don't need.
Pillar 2: Metrics, the "what"
Metrics are numbers over time, cheap to store and perfect for dashboards and alerts.
| Type | Example | Question it answers |
|---|---|---|
| Counter (only goes up) | http_requests_total | How many requests per second? |
| Gauge (up and down) | memory_used_bytes, queue_depth | How full is it right now? |
| Histogram | http_request_duration_seconds | What are p50, p95, p99 latencies? |
import client from "prom-client";

const httpDuration = new client.Histogram({
  name: "http_request_duration_seconds",
  help: "HTTP request latency",
  labelNames: ["method", "route", "status"],
  buckets: [0.01, 0.05, 0.1, 0.3, 1, 3],
});

app.use((req, res, next) => {
  const end = httpDuration.startTimer();
  res.on("finish", () => end({ method: req.method, route: req.route?.path ?? "unknown", status: res.statusCode }));
  next();
});

app.get("/metrics", async (req, res) => res.type("text/plain").send(await client.register.metrics()));
Why percentiles, not averages?
If 99 requests take 10 ms and 1 takes 5 seconds, the average is 60 ms: looks fine! But 1 in 100 users waits 5 seconds. p99 (the 99th percentile) shows that pain.
The four golden signals (Google SRE)
If you only build one dashboard, build this one, per service.
Pillar 3: Traces, the "where"
In a microservice system, one click might touch 8 services. A distributed trace follows that one request everywhere and shows how long each step took.
Immediately visible: payments takes 470 ms of the 820. That's where to look.
- Trace: the whole journey, with one
traceId. - Span: one step (a service call, a DB query) with start, duration and attributes.
- Context propagation: the
traceparentHTTP header carries the trace ID from service to service.
traceparent: 00-4bf92f3577b34da6a3ce929d0e0e4736-00f067aa0ba902b7-01
💡 Put the
traceIdin every log line. Then from a slow trace you can jump straight to the logs of exactly that request.
OpenTelemetry: one standard for all three
OpenTelemetry (OTel) is the vendor-neutral standard for collecting logs, metrics and traces. Instrument once, send the data anywhere.
// tracing.js — load before your app starts (node --import ./tracing.js server.js)
import { NodeSDK } from "@opentelemetry/sdk-node";
import { getNodeAutoInstrumentations } from "@opentelemetry/auto-instrumentations-node";

new NodeSDK({ instrumentations: [getNodeAutoInstrumentations()] }).start();
// HTTP, Express, pg, redis, fetch… are now traced automatically
SLIs, SLOs and error budgets
| Term | Meaning | Example |
|---|---|---|
| SLI (indicator) | What you measure | % of requests under 300 ms and not 5xx |
| SLO (objective) | Your target | 99.9% over 30 days |
| SLA (agreement) | A contract with customers, with penalties | 99.5% or refunds |
| Error budget | 100% − SLO | 0.1% ≈ 43 minutes of failure per month |
| Availability | Downtime per year | Per month |
|---|---|---|
| 99% | 3.65 days | 7.3 hours |
| 99.9% ("three nines") | 8.8 hours | 43.8 minutes |
| 99.99% | 52.6 minutes | 4.4 minutes |
| 99.999% | 5.3 minutes | 26 seconds |
Error budget left → ship features fast. Budget burned → focus on reliability.
Alerting that doesn't ruin your sleep
- ✅ Alert on symptoms users feel (error rate, latency SLO burn), not on every CPU spike.
- ✅ Every alert must be actionable and link to a runbook.
- ✅ Page for urgent issues, open a ticket for the rest.
- ❌ Avoid alert fatigue: noisy alerts get ignored, and then the real one is missed.
Key takeaways
- Metrics say what is wrong, traces say where, logs say why.
- Use structured JSON logs with a
traceIdon every line. - Watch the four golden signals: latency, traffic, errors, saturation. Use percentiles, not averages.
- Distributed tracing follows one request across all services.
- OpenTelemetry is the standard way to instrument; Grafana and friends visualise the data.
- Define SLOs, spend error budgets, and alert on user-facing symptoms.